Projects — AI & Automation
Investment Performance Dashboard.
A self-hosted system that turns raw brokerage data into institution-grade performance reporting — built in Python against the Schwab API, run on my own hardware. The design principle: numbers you saw yesterday should mean the same thing today.
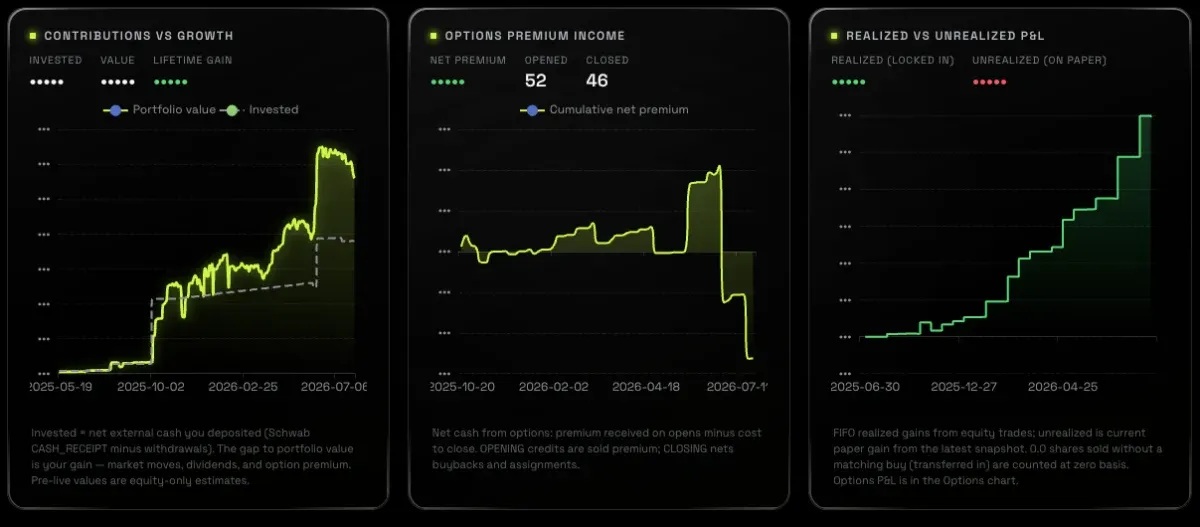
Invested
Portfolio value
Lifetime gain
Net option premium
Illustrative sample data — not actual holdings or results
Brokerages tell you what you have — not how you're doing.
Benchmarked truth
Every month, the portfolio's Modified-Dietz return runs next to the same dollars and deposit dates invested in SPY and QQQ. Deposit timing and account size can't flatter the result.
Contributions ≠ growth
A rising balance feels like winning even when it’s just new deposits. Net external cash is tracked separately from market gains, dividends, and premium — "invested" and "earned" never mix.
Options income, first-class
For a covered-call strategy, premium is a real income stream — net premium collected, contracts opened and closed, every short leg shown inside the positions table where it belongs.
One consolidated picture
Taxable, IRA, Roth, and trust accounts roll up into one weighted view — sector allocation, day moves, and staleness flags on every quote, so a stale price is never mistaken for a live one.
Built like a control environment.
The part that reflects my day job: data integrity is a first-class feature, the way a finance department treats internal controls. Completed months are computed once, validated, and frozen permanently — the same principle as a locked accounting period. If a month says +5.14%, it says +5.14% forever.
Anything estimated or provisional is visibly flagged, never silently blended. Broker data is cross-checked against the system's own price history — impossible figures get substituted and warned, never displayed. Every adjustment is reversible and auditable, the holdings log is append-only, and every panel is isolated so one failure can never take down the reporting.